
2012 Indiana Forest Products Price Report and Trend Analysis
By William L. Hoover and Greg Preston
Survey Procedures and Response
This report is intended to be used as an indication of price trends, not for the appraisal of logs or standing timber (stumpage). Data is collected once a year, but log prices are constantly changing. Standard appraisal techniques by those familiar with local market conditions should be used to obtain estimates of current market values for particular stands of timber or lots of logs. Because of the small number of mills reporting logging costs, “stumpage prices” estimated by deducting the average logging and hauling costs from delivered log prices must be interpreted with caution.
Data for this survey was obtained by a direct mail survey of all known sawmills, veneer mills, concentration yards, loggers, and firms producing wood chips, sawdust, etc., as a byproduct. Only firms operating in Indiana were included. Firms stating that they will not respond are dropped from the mailing list. The survey was conducted by the Indiana Agricultural Statistics Service and analyzed by Prof. Hoover. The prices reported are for logs delivered to the log yards of the reporting mills and concentration yards.
The complete Indiana Forest Products Price Report and Trend Analysis for 1942, 1954-2012 may be found at https://ag.purdue.edu/fnr/Pages/extforestsprice.aspx.
Survey procedures were the same as previous years. The questionnaire was mailed to 275 firms. Thirty-two were returned as undeliverable. There was an initial mailing and one reminder postcard sent to non-respondents. At least one call was made to all non-respondents that received the long form. The phone numbers for 23 firms were no longer working. Phone solicitations were made by enumerators of the Indiana Agricultural Statistics Service. Purdue’s Department of Forestry and Natural Resources pays for this assistance using funds from its John S. Wright Endowment, not tax-based funds.
Fifty-two mills reported some useful data, compared to 56 in 2011, 62 in 2010, 73 in 2009 and 88 in 2008. Seventeen mills were dropped because their phones were disconnected, or they reported being out of business.
The price statistics by species and grade don’t include data from small custom mills, because most do not buy logs, or they pay a set price for all species and grades of pallet-grade logs. They are, however, the primary source of data on the cost of custom sawing and pallet logs. The custom sawing costs reported in Table 3 do not reflect the operating cost of large mills.
Hardwood Lumber Prices
Lumber price changes from January 2009 to July 2012 varied, as always, by species. Perhaps the biggest surprise is that ash prices did not collapse because of increased harvests driven by the emerald ash borer (EAB), but instead prices are increasing. Demand has remained steady in the typical ash markets. An estimated five percent of the ash timber region has been impacted with hardly any in the southern region. At least for now, ash markets are driven by typical factors with anomalies limited to heavily infested areas where log movement is restricted.
Basswood prices remain depressed. They are unlikely to move back up until demand from the fixture sector needs to responds to increased housing starts and remodeling.
Beech continues to follow the pattern of steady prices for 5 to 6 years until a slight price increase sets a new price level that prevails for another 5 or 6 years. End uses of beech lumber are limited to those requiring very tight grain. Price movements for cottonwood are similar. This species is abundant as large defect free logs. This also applies to sycamore, a species that favors the same growing sites as cottonwood.
Black cherry’s return to its traditional ranking behind black walnut continues. Furniture production remains soft awaiting the much anticipated housing recovery. There’s a new reality in this sector as well. Lenders are restricting loans to borrowers with an above average chance of actually covering their loans. This has moved more families into the rental market, driving increases in multifamily construction in some markets. The impact on furniture and fixture sales is minimal since families driven by foreclosure to apartments aren’t in the market for new furniture.
Hickory prices have been rising this year. Both domestic and international markets are strong. The character marks associated with hickory provide furniture and fixture buyers with a distinctive real wood appearance that is affordable in solid wood pieces.
Demand for white-wood species, including hard and soft maple, is lower and driven by consumer preferences in both domestic and international markets. The declining economic growth rate in China has reduced housing starts, mostly multiunit.
White oak lumber prices remain soft, but up slightly so far this year. Mills serving the quarter- and rift-sawn markets have been kept busy this year by serving high-end markets. Logs destined for these mills can also be sliced for face veneer, providing a higher level of competition in the timber and log markets than for most other species.
Red oak prices have been up-and-down the last several years, and remain soft so far this year. The red oak fad, especially in the commercial building market, remains down. Red oak is left to survive in traditional furniture and fixture markets.
Yellow poplar is making a bit of a comeback as the demand for millwork firms up in response to growing increases in construction. Significant price increases, as always, are unlikely because of the readily available timber supply and ease of processing this species.
Black walnut lumber prices were moving up in 2011, but have now fallen off by 16 percent from last summer. Demand is down based on consumer preferences in the U.S. and overseas.
Sawlog Prices
The number of mills reporting sawlog prices was up slightly this year (Table 1). Changes varied by species with median prices showing less change than average price. This is because one out-of-range price changes the mean price more than the median price.
Consistent with price increases for ash lumber, log prices were up for all grades, 20 percent for No. 2’s. Basswood prices were essentially unchanged, as were beech and cottonwood.
Lower black cherry lumber prices are reflected in 15 to 20 percent declines in log prices. The lowest quality, No. 3’s, were up substantially. The log cost to lumber yield ratio remains sufficient for mills to process these logs.
The two upper grades of elm logs were up, likely reflecting their use for pallet lumber and blocking. Hickory prices varied greatly with increases for No. 2 logs.
Prices paid for the higher grade maple logs, hard and soft, increased. This is surprising given declines in lumber prices.
White oak prices were up slightly, most likely based on the availability of high grade logs for quarter-sawn and rift-cut lumber. As noted above, another factor is competition with white oak timber and log buyers for veneer mills. The decline in red oak lumber prices is reflected in log prices, down by as much as 14 percent. Black oak, a “substitute,” for red oak, showed price increases. Red oak lumber prices refer to lumber from any of the species in the red oak family. The lower cost for black oak logs makes them competitive even with lower yields of No. 1C and better lumber.
Tulip poplar log prices were up substantially. Sawmills are return to this species as demand increases. Good stands of this species are common in southern Indiana. Sycamore and black gum prices were generally down.
Black walnut log prices were down substantially, even median prices. The decline in log prices matched those for lumber, averaging about 15 percent in both cases. The median price of Prime logs was down almost 25 percent.
Veneer Log Prices
The number of mills reporting veneer log prices declined further this year. One more mill was added to the list of those doing only custom cutting. This refers to mills that do not take ownership of logs, but process those of other firms. In many cases these other firms are buying logs to convert to veneer to be exported.
Veneer log prices (Table 2) were down for all the species, and by more than 50 percent for some species-grade-size categories. The declines hit even the smaller sizes of lower grade, select logs. This indicates that the demand for veneer was not strong enough to justify substituting these lower cost logs for larger higher grade logs. Small lower grade logs require more handling per square foot of veneer produced. The veneer from such logs is usually trimmed for sale to producers of panels used in furniture construction.
Miscellaneous Products
Prices of the logs purchased at a bulk price decreased (Table 3). These are logs sawn or chipped into cants, and resawn into boards used for pallets or blocking, railroad ties, or other industrial applications. Pallet lumber logs decreased by $14 per MBF and $3 per ton. Prices received for by-products, such as sawdust and bark, were also down. Bark sold by the cubic yard was an exception. This price increased by $2 per yard.
Custom Costs
A large number of owners of small portable mills continue to saw logs brought to them. This practice harkens back to pioneer days when every county had a couple of mills that sawed logs into lumber needed by the log owners. Today they charge a fee per MBF or per hour. The cost for this service increased by about $25 per MBF. Logging costs increased significantly. The mean went from $96 to $163 per MBF. The number of firms reporting this cost increased significantly compared to previous years, making the 2011 cost estimate suspect. The logging cost increase is due in part to a decline in the number of loggers during the recession.
Indiana Timber Price Index
The delivered log prices collected in the Indiana Forest Products Price Survey are used to calculate the delivered log value of typical stands of timber. This provides trend-line information that can be used to monitor long-term prices for timber. The species and log quality weights used to calculate the index are described in previous editions of this report, available at https://ag.purdue.edu/fnr/Pages/extforestsprice.aspx. The weights are based primarily on the 1967 Forest Survey of Indiana. Adjusting the weights for more recent forest surveys did not change the series enough to justify converting to a new series.
The nominal (not deflated) price is a weighted average of the delivered log prices reported in the price survey. The price indexes are the series of nominal prices divided by the price in 1957, the base year, multiplied by 100. Thus, the index is the percentage of the 1957 price. For example, the average price in 2012 for the average stand was 687.3 percent of the 1957 price. This index for a quality stand decreased from 826.6 percent to 739.9 percent.
The real prices are the nominal prices deflated by the producer price index for finished goods, with 1982 as the base year. The real price series represents the purchasing power of dollars based on a 1982 market basket of finished producer goods. It’s this real price trend that is important for evaluating long-term investments like timber and the log input cost of mills. Receiving a rate of return less than the inflation rate means that the timber owner is losing purchasing power, a negative real rate of return.
Note that each year the previous year’s number is recalculated using the producer price index for finished goods for the entire year. The price index used for the current year is the last one reported for the month when the analysis is conducted: July this year. The inflation rate increased by1.36 percent from 2011 to June of this year.
Average Stand
The nominal weighted average price for a stand of average quality decreased from $388.5 per MBF in 2011 to $382.2 this year (Figure 1). This is a 1.62 percent decrease, continuing the downward trend. Remember that this series is based on delivered log prices, not stumpage prices.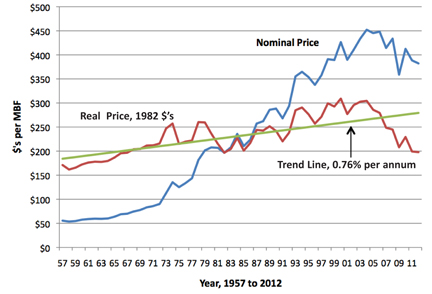
The deflated, or real, price decreased from $199.2 in 2011 to $197.9, a 0.6 percent decrease. This continues the trend since 2004 of dropping further below the historical trend line.
The new equation for the trend line for the 1957 to 2012 period is,
Avg. Stand Real Price = 182.42 + 1.73 ´ T, where,
T=1 for 1957, 2 for 1958 . . . 56 for 2012
We usually say that this linear trend line should be used to project real prices of a commodity like hardwood logs. The slope of this trend line depends on the starting point. The year 1957 is used simply because this is the first year data was available. A better year might be 1972, the start of the first large price cycle. Doing so reduces the slope of this trend line to $0.90, i.e. next year’s trend-line price is this much higher than the previous year. The average annual compound rate of increase from 1972 to 2012 based on this trend line is 0.37 percent. This means that the real rate of return from holding such a stand over the 41 years would be 0.37 percent. Most investors seek a real rate of return of at least 1 percent. The increase for the trend line starting in 1957 is 0.76 percent.
Quality Stand
The nominal weighted average price for a high-quality stand decreased from $550.41 last year to $492.70 this year (Figure 2). This is a 10.48 percent decrease. The average real price series for a high-quality stand decreased from $288.9 per MBF last year to $255.1 this year. This is an 11.69 percent decrease.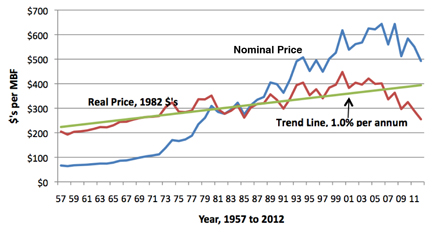
The average annual compound rate of increase for the trend line declined from 1.11 percent last year to 1.02 percent this year. The equation for the trend line is,
Quality Stand Real Price = 220.55 + 3.10 ´ T, where
T=1 for 1957, 2 for 1958 . . . 56 for 2012
The average annual compound rate of increase for a trend line starting in 1972 is 0.54 percent. This is a 50 percent cut in the average rate of return from holding such a stand of timber.
Dr. William Hoover is a Professor of Forestry in the Department of Forestry and Natural Resources at Purdue University. Greg Preston is the State Statistician for the Indiana Agricultural Statistics Service in West Lafayette, Indiana.
-----------------------------
Table 1. Prices paid for delivered sawlogs by Indiana sawmills, May 2011 and May 2012.
|
|
|
No. Responses |
Mean (standard error) |
Median |
Change (%) |
|||||||
|
Species/Grade |
2012 Range |
2011 |
2012 |
2011 |
2012 |
2011 |
2012 |
Mean |
Median |
|||
|
|
($/MBF) |
|
|
($/MBF) |
($/MBF) |
|
|
|||||
|
White Ash |
|
|
|
|
|
|
|
|||||
|
Prime |
300 – 600 |
12 |
17 |
418 / (24.21) |
457 / (22.87) |
400 |
450 |
9.3 |
12.5 |
|||
|
No. 1 |
200 – 550 |
15 |
19 |
333 / (12.85) |
371 / (19.59) |
350 |
400 |
11.3 |
14.3 |
|||
|
No. 2 |
150 – 400 |
15 |
19 |
254 / (11.54) |
283 / (14.49) |
250 |
300 |
11.3 |
20.0 |
|||
|
No. 3 |
150 – 250 |
13 |
13 |
196 / (12.89) |
215 / (17.54) |
200 |
230 |
9.8 |
20.0 |
|||
|
Basswood |
|
|
|
|
|
|
|
|
|
|||
|
Prime |
240 – 450 |
8 |
9 |
313 / (24.55) |
316 / (23.99) |
300 |
300 |
1.0 |
0.0 |
|||
|
No. 1 |
200 – 450 |
9 |
10 |
263 / (17.40) |
268 / (24.03) |
250 |
245 |
1.8 |
-2.0 |
|||
|
No. 2 |
150 – 300 |
9 |
10 |
221 / (16.17) |
228 / (16.79) |
225 |
240 |
3.4 |
6.7 |
|||
|
No. 3 |
100 – 300 |
9 |
10 |
187 / (15.18) |
202 / (18.18) |
200 |
200 |
8.2 |
0.0 |
|||
|
Beech |
|
|
|
|
|
|
|
|
|
|||
|
Prime |
240 – 300 |
8 |
9 |
258 / (16.6) |
258 / (8.13) |
250 |
250 |
0.1 |
0.0 |
|||
|
No. 1 |
200 – 250 |
9 |
10 |
228 / (7.60) |
242 / (6.2) |
240 |
250 |
6.2 |
4.2 |
|||
|
No. 2 |
150 – 250 |
9 |
10 |
217 / (10.93) |
227 / (4.8) |
220 |
240 |
4.8 |
9.1 |
|||
|
No. 3 |
150 – 250 |
9 |
9 |
211 / (10.2) |
219 / (3.7) |
200 |
240 |
3.7 |
20.0 |
|||
|
Cottonwood |
|
|
|
|
|
|
|
|
||||
|
Prime |
150 – 240 |
6 |
6 |
190 / (14.14) |
195 / (12.04) |
200 |
200 |
2.6 |
0.0 |
|||
|
No. 1 |
150 – 240 |
7 |
7 |
191 / (12.04) |
196 / (2.2) |
200 |
200 |
2.2 |
0.0 |
|||
|
No. 2 |
150 – 240 |
7 |
7 |
189 / (12.04) |
196 / (3.8) |
200 |
200 |
3.8 |
0.0 |
|||
|
No. 3 |
150 – 240 |
7 |
8 |
189 / (12.04) |
205 / (11.02) |
200 |
200 |
8.7 |
0.0 |
|||
|
Cherry |
|
|
|
|
|
|
|
|||||
|
Prime |
300 – 1100 |
13 |
16 |
782 / (74.28) |
672 / (50.20) |
750 |
625 |
-14.1 |
-16.7 |
|||
|
No. 1 |
200 – 800 |
16 |
18 |
613 / (51.94) |
471 / (31.95) |
550 |
475 |
-23.1 |
-13.6 |
|||
|
No. 2 |
150 – 700 |
16 |
18 |
373 / (31.38) |
350 / (27.42) |
325 |
350 |
-6.2 |
7.7 |
|||
|
No. 3 |
150 – 340 |
15 |
13 |
211 / (17.04) |
244 / (15.04) |
200 |
250 |
15.4 |
25.0 |
|||
|
Elm |
|
|
|
|
|
|
|
|
|
|||
|
Prime |
150 – 400 |
6 |
8 |
210 / (14.61) |
240 / (25.70) |
210 |
240 |
14.3 |
14.3 |
|||
|
No. 1 |
100 – 300 |
7 |
8 |
214 / (13.07) |
228 / (15.67) |
220 |
240 |
6.2 |
9.1 |
|||
|
No. 2 |
100 – 240 |
7 |
8 |
211 / (13.88) |
209 / (10.93) |
220 |
200 |
-1.3 |
-9.1 |
|||
|
No. 3 |
150 – 240 |
7 |
7 |
211 / (13.88) |
210 / (12.54) |
220 |
200 |
-0.7 |
-9.1 |
|||
|
Hickory |
|
|
|
|
|
|
|
|
|
|||
|
Prime |
200 – 750 |
12 |
16 |
423 / (54.83) |
401 / (27.79) |
400 |
400 |
-5.1 |
0.0 |
|||
|
No. 1 |
100 – 750 |
15 |
18 |
338 / (32.66) |
340 / (30.34) |
325 |
338 |
0.5 |
3.8 |
|||
|
No. 2 |
100 – 450 |
14 |
15 |
254 / (11.26) |
273 / (20.73) |
268 |
288 |
7.6 |
7.5 |
|||
|
No. 3 |
150 – 450 |
12 |
12 |
200 / (13.37) |
256 / (28.16) |
200 |
250 |
27.9 |
25.0 |
|||
|
Hard Maple |
|
|
|
|
|
|
|
|
||||
|
Prime |
300 – 1600 |
12 |
17 |
600 / (61.55) |
668 / (76.57) |
600 |
650 |
11.3 |
8.3 |
|||
|
No. 1 |
200 – 1200 |
15 |
17 |
477 / (35.81) |
494 / (53.01) |
500 |
500 |
3.7 |
0.0 |
|||
|
No. 2 |
150 – 550 |
15 |
17 |
343 / (11.26) |
341 / (26.99) |
350 |
350 |
-0.8 |
0.0 |
|||
|
No. 3 |
150 – 300 |
13 |
13 |
208 / (16.71) |
228 / (21.47) |
200 |
240 |
9.6 |
20.0 |
|||
|
Soft Maple |
|
|
|
|
|
|
|
|
|
|||
|
Prime |
250 – 550 |
10 |
14 |
332 / (22.15) |
368 / (23.79) |
325 |
400 |
10.8 |
23.1 |
|||
|
No. 1 |
200 – 550 |
13 |
15 |
275 / (12.79) |
303 / (21.68) |
250 |
300 |
10.2 |
20.0 |
|||
|
No. 2 |
150 – 400 |
13 |
14 |
233 / (10.69) |
248 / (18.19) |
240 |
240 |
6.5 |
0.0 |
|||
|
No. 3 |
100 – 300 |
11 |
13 |
209 / (12.68) |
240 / (16.15) |
220 |
240 |
2.3 |
9.1 |
|||
|
White Oak |
|
|
|
|
|
|
|
|||||
|
Prime |
350 – 1170 |
13 |
17 |
700 / (50.64) |
719 / (57.44) |
700 |
700 |
2.7 |
0.0 |
|||
|
No. 1 |
250 – 850 |
17 |
19 |
509 / (31.28) |
530 / (35.28) |
500 |
500 |
4.2 |
0.0 |
|||
|
No. 2 |
150 – 600 |
17 |
18 |
345 / (18.86) |
354 / (23.46) |
350 |
350 |
2.5 |
0.0 |
|||
|
No. 3 |
150 – 350 |
14 |
13 |
223 / (20.71) |
232 / (16.26) |
210 |
240 |
4.2 |
14.3 |
|||
|
Red Oak |
|
|
|
|
|
|
|
|
|
|||
|
Prime |
250 – 700 |
13 |
17 |
550 / (34.55) |
547 / (25.17) |
550 |
550 |
-0.5 |
0.0 |
|||
|
No. 1 |
200 – 650 |
16 |
19 |
430 / (20.57) |
424 / (22.47) |
450 |
400 |
-1.4 |
-11.1 |
|||
|
No. 2 |
150 – 450 |
16 |
19 |
339 / (17.30) |
317 / (17.52) |
350 |
300 |
-6.6 |
-14.3 |
|||
|
No. 3 |
150 – 350 |
15 |
13 |
225 / (18.10) |
225 / (17.34) |
220 |
240 |
0.0 |
9.1 |
|||
|
Black Oak |
|
|
|
|
|
|
|
|
|
|||
|
Prime |
150 – 700 |
13 |
16 |
504 / (35.90) |
503 / (30.44) |
500 |
500 |
-0.1 |
0.0 |
|||
|
No. 1 |
150 – 550 |
15 |
18 |
373 / (20.19) |
388 / (26.19) |
350 |
400 |
4.0 |
14.3 |
|||
|
No. 2 |
100 – 400 |
15 |
18 |
283 / (17.28) |
296 / (19.89) |
280 |
300 |
4.3 |
7.1 |
|||
|
No. 3 |
100 – 350 |
13 |
13 |
205 / (17.45) |
221 / (19.06) |
200 |
240 |
7.5 |
20.0 |
|||
|
Tulip Poplar |
|
|
|
|
|
|
|
|
|
|||
|
Prime |
150 – 500 |
13 |
16 |
338 / (19.56) |
381 / (18.73) |
350 |
400 |
12.8 |
14.3 |
|||
|
No. 1 |
100 – 450 |
16 |
18 |
278 / (14.51) |
307 / (19.60) |
275 |
300 |
10.5 |
9.1 |
|||
|
No. 2 |
100 – 350 |
16 |
15 |
219 / (14.21) |
242 / (17.13) |
210 |
250 |
10.3 |
19.0 |
|||
|
No. 3 |
100 – 250 |
14 |
13 |
182 / (13.18) |
202 / (13.81) |
200 |
200 |
10.6 |
0.0 |
|||
|
Sycamore |
|
|
|
|
|
|
|
|
|
|||
|
Prime |
150 – 300 |
9 |
9 |
229 / (20.24) |
241 / (12.96) |
240 |
250 |
5.3 |
4.2 |
|||
|
No. 1 |
100 – 250 |
10 |
10 |
220 / (14.76) |
222 / (16.65) |
230 |
245 |
0.9 |
6.5 |
|||
|
No. 2 |
100 – 250 |
10 |
10 |
215 / (12.41) |
207 / (15.57) |
230 |
220 |
-3.7 |
-4.3 |
|||
|
No. 3 |
100 – 250 |
9 |
9 |
206 / (12.26) |
202 / (16.56) |
200 |
200 |
-1.6 |
0.0 |
|||
|
Sweetgum |
|
|
|
|
|
|
|
|||||
|
Prime |
150 – 300 |
8 |
8 |
220 / (22.68) |
235 / (15.47) |
210 |
245 |
6.8 |
16.7 |
|||
|
No. 1 |
100 – 300 |
8 |
8 |
205 / (14.27) |
210 / (22.12) |
200 |
220 |
2.4 |
10.0 |
|||
|
No. 2 |
100 – 250 |
8 |
7 |
199 / (13.29) |
211 / (20.29) |
200 |
240 |
6.4 |
20.0 |
|||
|
No. 3 |
100 – 250 |
8 |
7 |
199 / (13.29) |
217 / (20.55) |
200 |
240 |
9.3 |
20.0 |
|||
|
Black Walnut |
|
|
|
|
|
|
|
|
|
|||
|
Prime |
700 – 1800 |
14 |
18 |
1389 / (85.83) |
1203 / (71.68) |
1450 |
1100 |
-13.4 |
-24.1 |
|||
|
No. 1 |
600 – 1350 |
17 |
19 |
1079 / (61.99) |
953 / (53.05) |
1000 |
900 |
-11.7 |
-10.0 |
|||
|
No. 2 |
300 – 1000 |
17 |
18 |
709 / (63.48) |
708 / (47.36) |
700 |
800 |
-0.1 |
14.3 |
|||
|
No. 3 |
100 – 800 |
15 |
13 |
393 / (67.94) |
369 / (48.22) |
350 |
350 |
-6.1 |
0.0 |
|||
|
Softwood |
|
|
|
|
|
|
|
|
|
|||
|
Pine |
150 – 250 |
5 |
4 |
228 |
203 / (20.56) |
220 |
205 |
-11.2 |
-6.8 |
|||
|
Red cedar |
150 – 450 |
5 |
3 |
347 |
333 / (92.80) |
400 |
400 |
-3.9 |
0.0 |
|||
Table 2. Prices paid for delivered veneer logs by Indiana mills, May 2011 and May 2012.
|
Species/ Grade/ Log Dia. |
|
No. Responses |
Mean (standard error) |
Median |
Change (%) |
|||||
|
2012 Range |
2011 |
2012 |
2011 |
2012 |
2011 |
2012 |
Mean |
Median |
||
|
|
|
($/MBF) |
($/MBF) |
($/MBF) |
|
|
||||
|
Black Walnut |
|
|
|
|
|
|
||||
|
Prime |
|
|
|
|
|
|
|
|
|
|
|
12–13 |
1200 – 5500 |
7 |
5 |
2500 / (189.2) |
2640 / (777.56) |
2500 |
2000 |
5.6 |
-20.0 |
|
|
14–15 |
2000 – 5500 |
9 |
5 |
3346 / (207.11) |
3240 / (602.16) |
3200 |
3000 |
-3.2 |
-6.3 |
|
|
16–17 |
2750 – 5500 |
10 |
6 |
4189 / (448.85) |
3708 / (420.40) |
3750 |
3500 |
-11.5 |
-6.7 |
|
|
18–20 |
1600 – 5500 |
10 |
7 |
5223 / (540.45) |
3979 / (524.84) |
4750 |
4000 |
-23.8 |
-15.8 |
|
|
21–23 |
2750 – 6000 |
10 |
5 |
6145 / (737.82) |
4950 / (614.41) |
5500 |
5500 |
-19.5 |
0.0 |
|
|
24–28 |
2750 – 7000 |
9 |
4 |
6575 / (1027.76) |
5063 / (880.19) |
6000 |
5250 |
-23.0 |
-12.5 |
|
|
>28 |
2750 – 8000 |
7 |
4 |
6499 / (646.24) |
5563 / (1081.93) |
7000 |
5750 |
-14.4 |
-17.9 |
|
|
Select |
|
|
|
|
|
|
|
|
|
|
|
12–13 |
1000 – 2750 |
4 |
4 |
1738 / (167.55) |
1488 / (423.47) |
1750 |
1100 |
-14.4 |
-37.1 |
|
|
14–15 |
1400 – 2750 |
5 |
4 |
2530 / (399.87) |
1788 / (321.70) |
2500 |
1500 |
-29.3 |
-40.0 |
|
|
16–17 |
1400 – 2750 |
6 |
4 |
2900 / (365.38) |
2038 / (343.62) |
3000 |
2000 |
-29.7 |
-33.3 |
|
|
18–20 |
1600 – 3500 |
6 |
4 |
3775 / (758.70) |
2413 / (440.82) |
3750 |
2275 |
-36.1 |
-39.3 |
|
|
21–23 |
1800 – 2750 |
6 |
3 |
4380 / (957.46) |
2183 / (289.16) |
4250 |
2000 |
-49.3 |
-52.9 |
|
|
24–28 |
1800 – 2750 |
4 |
3 |
5650 / (1834.17) |
2350 / (284.31) |
5250 |
2500 |
-58.4 |
-52.4 |
|
|
>28 |
2000 – 2750 |
3 |
3 |
4533 / (1576.21) |
2417 / (220.48) |
5000 |
2500 |
-46.7 |
-50.0 |
|
|
White Oak |
|
|
|
|
|
|
|
|
||
|
Prime |
|
|
|
|
|
|
|
|
|
|
|
13–14 |
1150 – 2400 |
8 |
2 |
1262 / (118.15) |
1775 / (625.00) |
1225 |
1775 |
40.6 |
44.9 |
|
|
15–17 |
1400 – 2400 |
8 |
3 |
1638 / (150.31) |
1933 / (290.59) |
1775 |
2000 |
18.1 |
12.7 |
|
|
18–20 |
1400 – 2400 |
8 |
4 |
2096 / (177.70) |
1950 / (206.16) |
2200 |
2000 |
-7.0 |
-9.1 |
|
|
21–23 |
2400 – 2500 |
8 |
3 |
2604 / (112.02) |
2467 / (33.33) |
2590 |
2500 |
-5.3 |
-3.5 |
|
|
24–28 |
2400 – 2750 |
8 |
3 |
3067 / (144.94) |
2633 / (116.67) |
3000 |
2750 |
-14.1 |
-8.3 |
|
|
>28 |
2400 – 3000 |
7 |
3 |
3290 / (238.23) |
2800 / (200.00) |
3500 |
3000 |
-14.9 |
-14.3 |
|
|
Select |
|
|
|
|
|
|
|
|
|
|
|
13–14 |
500 |
3 |
1 |
1017 / (216.67) |
500 |
1000 |
500 |
-50.8 |
-50.0 |
|
|
15–17 |
750 – 1000 |
3 |
2 |
1167 / (260.34) |
875 / (125.00) |
1200 |
875 |
-25.00 |
-27.1 |
|
|
18–20 |
750 – 1000 |
3 |
2 |
1533 / (266.67) |
875 / (125.00) |
1800 |
875 |
-42.9 |
-51.4 |
|
|
21–23 |
1000 |
3 |
2 |
1833 / (440.96) |
1000 |
2000 |
1000 |
-45.5 |
-50.0 |
|
|
24–28 |
1000 |
3 |
2 |
2267 / (635.96) |
1000 |
2800 |
1000 |
-55.9 |
-64.3 |
|
|
>28 |
1000 |
2 |
2 |
2250 / (1250.00) |
1000 |
2250 |
1000 |
-55.6 |
-55.6 |
|
|
Black Cherry |
|
|
|
|
|
|
|
|||
|
Prime |
|
|
|
|
|
|
|
|
||
|
12–13 |
NA |
2 |
0 |
1100 / (100.00) |
NA |
1100 |
NA |
NA |
NA |
|
|
14–15 |
2000 – 3500 |
6 |
3 |
2292 / (417.62) |
2500 / (500) |
1900 |
2000 |
9.1 |
5.3 |
|
|
16–17 |
2000 – 3500 |
7 |
4 |
2550 / (390.51) |
2563 / (359.04) |
2000 |
2375 |
0.5 |
18.8 |
|
|
18–20 |
2100 – 3500 |
7 |
4 |
3100 / (603.96) |
2650 / (315.57) |
2500 |
2500 |
-14.5 |
0.0 |
|
|
21–23 |
2250 – 3500 |
7 |
4 |
3586 / (704.55) |
2750 / (270.03) |
3000 |
2625 |
-23.3 |
-12.5 |
|
|
24–28 |
2250 – 3500 |
5 |
4 |
4500 / (974.68) |
2750 / (270.03) |
4000 |
2625 |
-38.9 |
-34.4 |
|
|
>28 |
2400 – 3500 |
4 |
4 |
3875 / (657.49) |
2788 / (248.64) |
4000 |
2625 |
-28.1 |
-34.4 |
|
|
Select |
|
|
|
|
|
|
|
|
|
|
|
12–13 |
600 |
1 |
1 |
800 |
600 |
800 |
600 |
-25.0 |
-25.0 |
|
|
14–15 |
600 – 1000 |
3 |
2 |
1817 / (841.79) |
800 / (200.0) |
1000 |
800 |
-56.0 |
-20.0 |
|
|
16–17 |
600 – 2750 |
3 |
3 |
2033 / (883.80) |
1483 / (649.57) |
1200 |
1100 |
-27.0 |
-8.3 |
|
|
18–20 |
600 – 2750 |
3 |
3 |
2883 / (1331.14) |
1517 / (640.53) |
2000 |
1200 |
-47.4 |
-40.0 |
|
|
21–23 |
1000 – 2750 |
3 |
3 |
3300 / (1497.78) |
1650 / (553.02) |
2500 |
1200 |
-50.0 |
-52.0 |
|
|
24–28 |
1000 – 2750 |
2 |
3 |
2375 / (1125.00) |
1650 / (553.02) |
2375 |
1200 |
-30.5 |
-49.5 |
|
|
>28 |
1000 – 2750 |
2 |
3 |
2875 / (1625.00) |
1650 / (553.02) |
2875 |
1200 |
-42.6 |
-58.3 |
|
|
Red Oak |
|
|
|
|
|
|
|
|||
|
Prime |
|
|
|
|
|
|
|
|
|
|
|
16–17 |
550 – 1250 |
8 |
4 |
1166 / (98.11) |
925 / (145.06) |
1100 |
950 |
-20.7 |
-13.6 |
|
|
18–20 |
800 – 1250 |
7 |
4 |
1292 / (112.08) |
988 / (96.56) |
1200 |
950 |
-23.5 |
-20.8 |
|
|
21–23 |
850 – 1250 |
7 |
4 |
1401 / (126.29) |
1000 / (88.98) |
1500 |
950 |
-28.6 |
-36.7 |
|
|
24–28 |
900 – 1250 |
7 |
3 |
1450 / (146.35) |
1050 / (104.08) |
1500 |
1000 |
-27.6 |
-33.3 |
|
|
>28 |
900 – 1250 |
5 |
3 |
1466 / (157.30) |
1050 / (104.08) |
1500 |
1000 |
-28.4 |
-33.3 |
|
|
Select |
|
|
|
|
|
|
|
|
|
|
|
16–17 |
550 – 900 |
3 |
3 |
967 / (33.33) |
700 / (104.08) |
1000 |
650 |
-27.6 |
-35.0 |
|
|
18–20 |
650 – 900 |
3 |
3 |
1033 / (88.19) |
733 / (83.33) |
1000 |
650 |
-29.0 |
-35.0 |
|
|
21–23 |
650 – 900 |
3 |
2 |
1133 / (185.59) |
775 / (125.00) |
1000 |
775 |
-31.6 |
-22.5 |
|
|
24–28 |
650 – 900 |
3 |
2 |
1233 / (284.80) |
775 / (125.00) |
1000 |
775 |
-37.2 |
-22.5 |
|
|
>28 |
650 – 900 |
2 |
2 |
1400 / (400.00) |
775 / (125.00) |
1400 |
775 |
-44.6 |
-44.6 |
|
|
Hard Maple |
|
|
|
|
|
|
|
|||
|
Prime |
|
|
|
|
|
|
|
|
|
|
|
16–20 |
1400 – 2000 |
7 |
4 |
1854 / (182.89) |
1850 / (150.00) |
2000 |
2000 |
-0.2 |
0.0 |
|
|
>20 |
1400 – 2000 |
6 |
3 |
1925 / (294.32) |
1800 / (200.00) |
2000 |
2000 |
-6.5 |
0.0 |
|
|
Select |
|
|
|
|
|
|
|
|
|
|
|
16–20 |
950 – 1400 |
2 |
3 |
1500 / (500.00) |
1117 / (142.40) |
1500 |
1000 |
-25.6 |
-33.3 |
|
|
>20 |
950 – 1400 |
2 |
2 |
1750 / (750.00) |
1175 / (225.00) |
1750 |
1175 |
-32.9 |
-32.9 |
|
|
Yellow Poplar |
|
|
|
|
|
|
|
|
|
|
|
Prime |
|
|
|
|
|
|
|
|
|
|
|
16–20 |
400 – 500 |
4 |
2 |
575 / (85.39) |
450 / (50.00) |
550 |
450 |
-21.7 |
-18.2 |
|
|
>20 |
400 – 500 |
4 |
2 |
600 / (81.65) |
450 / (50.00) |
600 |
450 |
-25.0 |
-25.0 |
|
|
Select |
|
|
|
|
|
|
|
|
|
|
|
16–20 |
350 – 500 |
1 |
2 |
400 |
425 / (75.00) |
400 |
425 |
6.3 |
6.3 |
|
|
>20 |
350 – 500 |
1 |
2 |
600 |
425 / (75.00) |
600 |
425 |
-29.2 |
-29.2 |
|
Table 3. Prices of miscellaneous products reported by Indiana mills, May 2011 and May 2012, free on board (fob) the producing mill
|
|
Mean |
Median |
||||
|
|
No. Responses |
2012 Range |
2011 |
2012 |
2011 |
2012 |
|
Pallet logs, $/MBF |
24 |
140 – 340 |
250 |
236 |
250 |
240 |
|
Pallet logs, $/ton |
6 |
10 – 38 |
32 |
29 |
34 |
34 |
|
Sawn cants |
1 |
320 |
310 |
320 |
310 |
320 |
|
Pulpwood, $/ton |
1 |
35 |
30 |
35 |
30 |
35 |
|
Pulp chips, $/ton |
12 |
5.5 – 32.1 |
27 |
22 |
28 |
22 |
|
Sawdust, $/ton |
5 |
3.43 – 15 |
12 |
10 |
9 |
10 |
|
Sawdust, $/cu. yd. |
13 |
3 – 10 |
5 |
5 |
4.38 |
5 |
|
Bark, $/ton |
5 |
5 – 20 |
10 |
12 |
8.5 |
12 |
|
Bark, $/cu. yd. |
12 |
3 – 18 |
7 |
9 |
4.6 |
7 |
|
Mixed, $/ton |
0 |
|
12 |
|
12 |
|
|
Mixed, $/cu. yd. |
0 |
|
|
|
|
|
-------------------------------------------------------
Figure 1. Average stand of timber: nominal, deflated, and trend-line price series, 1957-2012.
Figure 2. Quality stand of timber: nominal, deflated, and trend-line price series 1957-2012.