
2013 Indiana Consulting Foresters Stumpage Timber Price Report
This stumpage report is provided annually and should be used in association with the Indiana Forest Products Price Report and Trend Analysis published in the Fall issue of the Woodland Steward Newsletter.
Stumpage prices were obtained via a survey to all known professional consulting foresters operating in Indiana. Reported prices are for sealed bid timber sales only (not negotiated sales) between a motivated timber seller and a licensed Indiana timber buyer. The data represents approximately 10 to 15 percent of the total volume of stumpage purchased during the periods from April 16, 2012 through April 15, 2013. This report has been published annually since 2001.
The results of this stumpage price survey are not meant as a guarantee that amounts offered for your timber will reflect the range in prices reported in this survey. The results simply provide an additional source of information to gauge market conditions.
WHAT ARE SEALED BID TIMBER SALES: The sealed bid timber sale process is for trees marked by a professional forester. The species, number of trees and volume in a sealed bid sale are determined prior to the notice of sale. A notice is sent to licensed timber buyers who then inspect the timber and offer a price for said trees at a predetermined time and place. Under conditions determined in the bid notice, the owner then accepts or rejects the bids.
Upon acceptance of the bids by the owner and the fee paid, the owner then conveys the right to cut the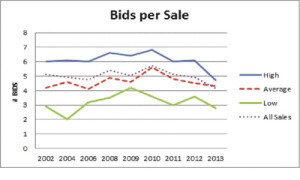 Figure 1 – Average number of bids per sale by sale quality and year.
 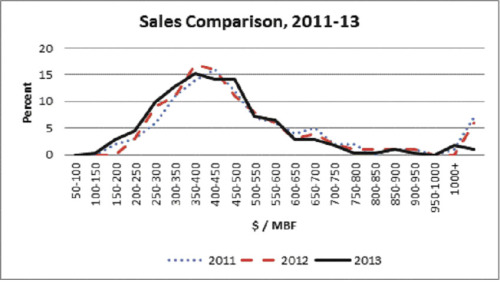 Figure 2 – Percentage of sales by price range (MBF), 2011-13. Note the low percentage of sales in 2013 for $1000 MBF
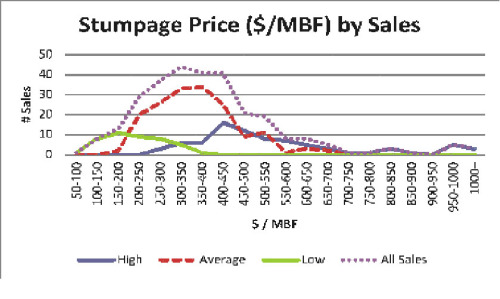 Figure 3 – Stumpage prices by number of sales for all sales and by sale quality and type, 2013.
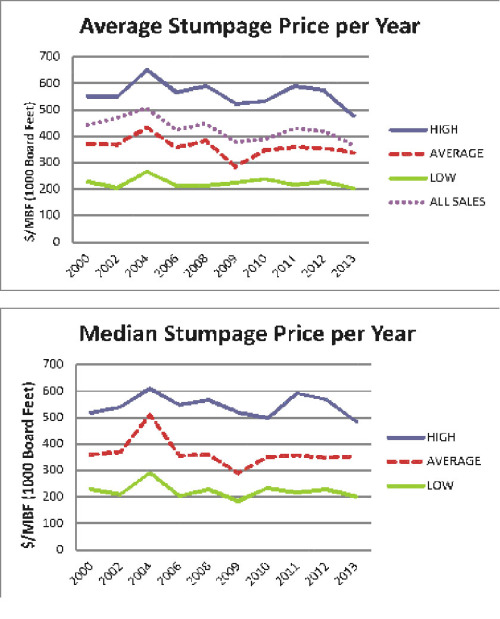 Figure 4 – Average (top) and mean (bottom) stumpage price by year.advertised trees to the purchaser. This is frequently referred to as a lump sum timber sale. More detailed information on this process is available in Purdue FNR publication 111 – “Marketing Timber” or FNR – 138 “How to get the Most from Your Timber Sale”. These publications and others are available on line at: http://www.agcom.purdue.edu/agcom/Pubs/fnr.htm
This report reflects “spot market” prices, not the average price paid by timber buyers. The bidding process used by consultants “spots” the maximum amount any buyer is willing to pay for a particular lot of timber at a particular time and place, not the average price paid for timber. High bids frequently reflect an urgent need for timber because of special orders for lumber or veneer, low log inventories at the buyer’s mill, poor logging conditions due to wet weather, or other special conditions. Consulting foresters also may advise the landowner to adjust the species and quality of a harvest at a specific time due to current demand.
Hardwood lumber is sold in a highly competitive commodity market. Competition comes from mills within the state, region, and hardwood lumber producers in the Lake States, Northeast, South and Southeastern production areas. This market competition means that the cost of stumpage in other producing regions determines in part the amount Indiana mill and loggers can pay for stumpage. If all timber were sold on a bid basis the spot market would no longer exist and the average of the highest bid price offered would be lower than now observed. This explanation isn’t meant to deter you from seeking the best available price. It’s meant to explain the apparent discrepancy between the two price reporting systems.
CATAGORIES OF TIMBER REPORTED: The prices reported are broken into three sale types – high quality, average quality, and low quality. A high quality sale is one where more than 50 percent of the volume is #2 grade or better red oak, white oak, sugar maple, black cherry, or black walnut. The low quality sale has more than 70 percent of the volume in #3 “pallet” grade or is cottonwood, beech, elm, sycamore, hackberry, pin oak, aspen, black gum, black locust, honey locust, catalpa, or sweet gum. The average sale is a sale that is not a low quality sale or a high quality sale as defined above.
In the 2008 report some minor adjustments were made in the categories from previous surveys. White ash was previously included as a component of the high quality timber sales and hickory was previously in the low quality group. No additional changes in the groups have been made since, so the 2013 data should compare well with data collected from 2008 thru 2012.
SALE ACTIVITY UP FOR LOWER AND MEDIUM QUALITY SALES: In 2013, 289 sales (plus 13 negotiated sales with 1,308,470 board feet selling for a combined $303,300) were reported compared to 290 sales (plus 13 negotiated sale) in 2012. The number of sales appears to be similar, however 3 firms (representing 34 sales in 2012) did not provide data this year due to time constraints, one new firm reported data (2 sales). There were 271 sales in 2011, 206 sales in 2010, 247 sales in 2009, and 283 in 2008 (pre-recession).
Seventeen consulting firms (one firm split into two companies) reported data in 2013, compared to 18 firms in 2012, 17 firms in 2011, 21 firms in 2010, 16 firms in 2009 and 11 firms (representing 14 to 15 current firms) in 2008. Fourteen firms that reported in 2012 and 2011 showed a similar number of sales with an increase from 267 to 286 sales during the period. All consultants that reported had sales in this reporting period.
Sales by quality type for the 2013 period were 80 (101 in 2012) high quality sales, 166 (157 in 2012) medium quality, and 43 (32 in 2012) low quality sales.
BIDDING DECLINES: (Figure 1) In 2013, a total of 1,203 bids was received for an average of 4.16 bids per sale. The overall total is down from 2012 and 2011 when a total of 1,432 bids (2012) and 1,391 bids (2011) were submitted for the 290 and 271 bid sales or 4.94 bids per sale and 5.13 bids per sale, respectively. These totals are down from 2010 (5.7 bids per sale – the highest since the stumpage report began in 2000) and are significantly lower than averages from all sales since 2000 (5.14 bids per sale). The 2013 average of 4.16 of bids offered per sale includes 4.7 for high quality (6.1 in 2012 and 6.0 in 2011), 4.3 for medium quality (4.5 in 2012 and 4.8 in 2011), and 2.8 for low quality (3.6 in 2012 and 3.3 in 2011). The 11 year averages are 6.2, 4.7, and 3.2 bids per sale for the respective quality groups.
The number of bids for all sales is significantly lower during this reporting period. The reduction is likely due to an increase in the volume on the market, a higher number of lower and medium quality sales that typically draw less interest, and a decline in the number of sawmills and producers that did not survive the recession.
VOLUME OF LOW AND MEDIUM QUALITY SALES INCREASE: A total stumpage volume 28,650,085 board feet sold during this period is up from of 25,164,871 board feet sold last period and 24,367,251 board feet sold in 2011. All three years are up considerably from the 17,687,648 board reported during the 2010 reporting period and 19,256,439 board feet reported in 2009. The volume of timber reported is very similar to the volume of around 25 million board feet sold in 2008 and 2006 (pre-recession).
High quality sales totaled 8,725,647 board feet in 2013 is up slightly from 8,671,566 board feet reported in 2012 and 8,598,937 board feet reported in 2011 but still below the 10 million board feet levels of 2008 and 2006. This reduction is likely due to ash being shifted from the high value to medium value category in 2008. Medium quality sales totaled 16,811,195 board feet up from 14,428,279 board feet in 2012 and 14,077,574 reported in 2011 up from the 11 to 12 million board feet from 2010 thru 2006. Low quality sales increased to 3,113,243 board feet up considerably from 2,065,026 board feet in 2012 and 1,690,740 reported in 2011 but very similar to the 3 million board feet reported in 2009, 2008, and 2006.
VALUE: Total timber value sold in the 2013 reporting period was $10,494,377 which is very similar to the 2012 period $10,559,277 and the 2011 period $10,678,849 and up from 2010 and 2009 ($6,889,190 and $7,278,302, respectively) and similar to the values reported in 2008 and 2006 (the volume of timber sold was also similar during these periods). Total value by type was $4,171,085 for high quality down from $4,968,313 in 2012 for high quality ($5,257,530 in 2011), $5,689,825 for medium quality up from $5,118,780 in 2012 ($5,052,387 in 2011), and $633,467 for low quality up from $472,184 in 2012 ($368,932 in 2011).
STUMPAGE PRICE DROP CONFUSING – NOT REALLY INDICATIVE OF CURRENT MARKET: The data collected this year seems to indicate a considerable drop in the stumpage prices for high quality, low quality and all sales categories. This contradicts most of the comments that were submitted that indicate an improvement in stumpage prices. A reduction in high quality sales is the likely cause for this difference (Figure 2). In 2013 there were only 3 timber sales that brought over $1 per board foot compared to 16 sales in 2012 and 19 sales in 2011.
Prior to 2011, several consultants reported a reluctance to sell high quality timber. The large number of very high quality sales reported in 2011 and 2012 were likely due to a backlog of very high quality sales that developed when many consultants and landowners delayed sales during the recession. Strong demand for white oak and black walnut fueled much of this activity in the 2011and 2012 periods. This year the number of very high quality sales returned to normal resulting in what appears to be a drop in stumpage price, especially for high quality sales.
The other factor that influenced the price for all sales is an increase in the number of low quality sales from 25 in 2011 to 32 in 2012 to 43 in 2013 and a decline in the number of high quality sales from 101 sales in 2011 and 2012 to 80 in 2013. Although markets are promising and they should be monitored to determine when to sell timber, the most important factors on when to sell timber are the condition of the tree (is the tree increasing in value or declining – is it’s health and vigor going to improve, decline, or stay the same) and the impact of the tree on future woodland regeneration (maintaining high quality genetic stock).
STUMPAGE PRICES: Figure 3 shows the stumpage prices for all sales, high quality sales, average quality sales, and low quality sales held from April 16, 2012 thru April 15, 2013. The data shows a typical bell curve for low quality, average quality and all sales. High quality sales generally have a wide range of stumpage prices due to higher quality timber or potential veneer therefore the stumpage price fluctuates considerably. Any sale, regardless of quality, can be affected by a veneer component. It is important for landowners to realize their timber typically will fall within the range of stumpage prices, but probably will not fall into the outlying values. This makes it important to work with a professional when selling timber so that you know what you have. For example, a few walnut trees can greatly distort the value of a low quality improvement sale dominated by pallet material.
The weighted average stumpage price by sale type (obtained from this survey in 2000, 2002, 2004, 2006, 2008, 2009, 2010, 2011, 2012 and 2013) is reported in Figure 4. The weighted average of the stumpage price is the total value ($) for each sales group (high, average, low) divided by the total volume by sales group. The median stumpage price by sale type per year is reported in Figure 4. The median price is the amount where half of the sales are higher and half are lower. The price reported is per 1000 board feet (MBF) of standing timber. To obtain a price per board foot, divide the price by 1000. An average price of $366 per thousand (MBF) is the same as 36.6 cents per board foot stumpage. The average stumpage price for all sales was $366/MBF. Below is a statistical summary for all three sale types.
High Quality Sales: The average stumpage price of high quality sales was $478 per 1000 board feet (MBF), down considerably from $573/MBF (2012) and $589/MBF (2011). The median stumpage price this year of $485/MBF was also down considerably from $568/MBF (2012) and $592/MBF (2011) (See Figure 4).
Average Quality Sales: The average stumpage price for average quality sales was $338/MBF which is slightly lower than $355/MBF in 2012 and $359/MBF in 2011 and $347/MBF in 2010, and up $320/MBF in 2009 (median price was $354/MBF which is similar to $349/MBF for 2012 and $358/MBF for 2011 and $352/MBF in 2010 and up from $314/MBF in 2009). The median price for average quality was similar to the median stumpage price in 2008 ($359/MBF) and 2006 ($357/MBF) (See Figures 4).
Low Quality Sales: The average stumpage price for the low quality sales was $203/ MBF down from $229/MBF in 2012 and $218/MBF in 2011 with a median price of $202/MBF down from $229 in 2012 and $217/MBF in 2011. Some of the decline in the price offered for the low quality sales is likely due to the fluctuation in the operating costs associated with the cost of fuel. The profit margins are tighter with lower valued timber; therefore, they are impacted more by operating costs (See Figure 4).
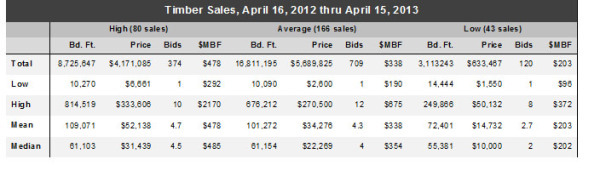 Table 1. Statistical Summary for High, Average, and Low Quality Sealed Bid Timber SalesSUMMARY: The last few years have been very interesting and confusing. Fortunately things are looking up. Prices, for the most part, have returned to levels prior to the recession (although not quite to the housing boom levels) so more timber is going on the market. The larger trees and better quality timber as usual have the most demand. Demand for some species, such as black walnut and white oak, is strong. Red oak and sugar maple are in more demand and the prices have improved. Good “white” soft maple is doing well. Ash and tulip appear to be down, especially in areas with heavy mortality due to emerald ash borers, drought and scale. Black cherry markets are still down from historical highs a few years ago but they are beginning to improve.
It is still likely that the prices paid for some species may not return to the high levels seen during the “high demand years” associated with the housing boom over the last decade or so. Fortunately, much of the timber from Indiana is high quality and in demand throughout the world and Indiana’s forest industry has positioned itself well to compete in the global marketplace.
Demand for low quality timber, especially if near low grade mills is strong, although higher operating costs associated with fuel prices are having an impact on the prices paid. It is important to remember that low quality sales are generally improvement cuts where trees are harvested that are impeding the growth of future higher value crop trees. Therefore, the opportunity costs of leaving the trees may cost more in lost productivity for high value crop trees, so it is generally not advantageous to delay selling lower quality if the price is reasonable.
The industry still seems to be carrying a smaller inventory and cutting sales quicker than in the past, creating more of a spot market for timber sold. There still is some reluctance from some consultants to market some species, especially black cherry.
The comment section below is offered to our readers by the consulting foresters who participated in this survey:
• Ash market in areas with heavy ash mortality (EAB) has been eaten up by the borer.
• Ash is moving well for larger, better quality trees that are still alive.
• Ash is getting to be more difficult to sell, especially in heavily infested areas. Mostly salvage harvests yielding pallet lumber.
• Tulip (poplar) problems resulting from the drought and scale infestation in southern Indiana are generating several calls from landowners now that they are more visible since they are foliated.
• Many poplar trees are cutting poorly as a result of the drought and scale. Mills have been suggesting cutting them harder.
• Tulip poplars on the upper ridges are cutting worse than those on low slopes, especially north aspects.
• For upland mixed oak / tulip prices were up this winter but have moved back down this spring to just above last spring’s levels.
• Red oak demand is improving, especially for larger quality timber.
• Mills are more eager to have red oak logs delivered.
• White oak demand is strong, especially for larger quarter sawn logs.
• Sugar / hard maple is looking good. Up a lot from last few years.
• Soft maple, if white, is moving very well.
• Black cherry markets still soft, but beginning to improve.
• Black walnut markets good. Anticipate increase towards the fall.
Consulting Foresters that have contributed to this report in alphabetically order include: Arbor Terra Consulting (Mike Warner), Crowe Forest Management LLC (Tom Crowe), Christopher Egolf, Gandy Timber Management (Brian Gandy), Gregg Forestry Services (Mike Gregg), Habitat Solutions LLC (Dan McGuckin), Haney Forestry, LLC (Stuart Haney), Multi-Resource Management, Inc. (Thom Kinney), Meisberger Woodland Management (Dan Meisberger), Chris Neggers, North Slope Forestry (Don Duncan), Quality Forest Management, Inc (Justin Herbaugh), Schuerman Forestry (Joe Schuerman), Stambaugh Forestry (John Stambaugh), Steinkraus Forest Management, LLC (Jeff Steinkraus), Turner Forestry, Inc. (Stewart Turner), and Wakeland Forestry Consultants, Inc. (Bruce Wakeland).