Fall 2010 Volume 19 No. 3
2010 Indiana Forest Products Price Report and Trend Analysis By William L. Hoover & Greg Preston
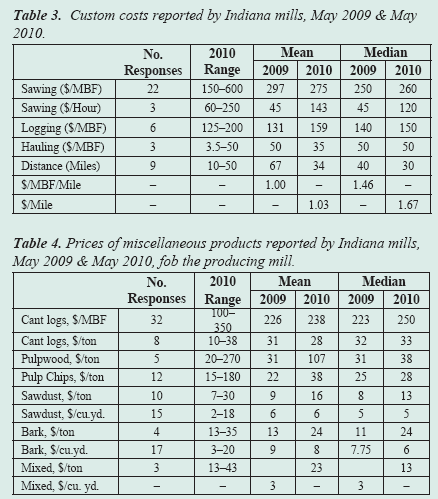
Survey Procedures and Response Data for this survey wasobtained by a direct mail survey of all known sawmills, veneer mills, concentration yards, loggers, and firms producing wood chips, sawdust, etc., as a byproduct. Only firms operating in Indiana were included. The survey was conducted by the Indiana Agricultural Statistics Service. The prices reported are for logs delivered to the log yards of the reporting mills and concentration yards. This report is intended to be used as an indication of price trends, not for the appraisal of logs or standing timber (stumpage). The survey was mailed to 293 firms, an increase of 81 compared to the 2009 survey. The year’s list was expanded by an internet search for any firm that appeared appropriate. There was an initial mailing and one reminder postcard sent to non-respondents. A portion of the firms not responding were contacted by phone by enumerators of the Indiana Agricultural Statistics Service. Purdue’s Department of Forestry and Natural Resources pays for this assistance using funds from its John S. Wright Endowment, not from public funds. An abbreviated survey form was used for the 111 firms that do not buy logs. The long form with the tables for prices paid for sawlogs and veneer logs went to 182 firms. Sixty-two mills reported some useful data, compared to 73 last year and 88 in 2008. Twenty-eight specifically declined to provide data, 11 were returned for bad addresses, and four reported that they didn’t buy logs. Thus, 123 mills were accounted for making the overall response rate 50 percent, slightly below last year’s 54 percent. The price statistics by species and grade don’t include data from small custom mills, because most do not buy logs, or they pay a set price for all species and grades of pallet grade logs. They are, however, the primary source of data on the cost of custom sawing. Thus, the custom sawing costs reported in Table 3 do not reflect the operating cost of large mills. Hardwood Lumber Prices If you compare the current business climate to post-WWII business cycles, the overall economy and the housing market should have been cycling up for at least the last six months. Some economists have concluded that the U.S. economy is undergoing a fundamental restructuring. They often add to this the projection that it’s unlikely our children will be better off than we are financially. In other words, per capita economic growth in GDP will decline. It’s not apparent that policy makers understand the implications of this. Rather than freeing up resources for growth and the psychological and behavior patterns associated with growth, they are burdening the economy with an unprecedented public debt and sending signals to those making growth happen to lower their expectations. Economic growth critically depends on individuals’ expectations that hard work, investments in higher education, and investments in productive assets will make them better off. That said, the economy is undergoing a very slow recovery, the rate of which is tied primarily to the ability of financial institutions to clear out bad housing loan portfolios and to the economic growth of our international trading partners. In the last price report we indicated that an uptick was underway for hardwood lumber and veneer. This turned out to be true, but was driven almost exclusively by rebuilding inventories drawn down by lowered production of green lumber to the point that even the anemic levels of finished goods output could not be sustained. Inventories for most species and grades of hardwood lumber caught up over last winter, but with at best break-even mill margins. As is to be expected in business cycles, the decline in stumpage offerings and resulting log production fell more than the demand for logs. Forestland owners knew that demand for stumpage had declined along with offering prices. They were in no rush to sell, an advantage of investing in timber. This market provides an advantage to mills that own timberland with timber they can draw on. Although their return on timber is lower because of market-based transfer pricing, their mill margin is higher, because they don’t need to buy as much open-market wood as they would otherwise. The worst-case scenario is mills that had locked in stumpage contracts when prices were higher. They are "underwater" on these contracts to use the current term for owing more on a contract (mortgage) than the property is worth. Lumber prices for most species increased over the spring, but only ash is close to its most recent peak in 2005. Apparently programs to control the spread of the emerald ash borer (EAB) have restricted the flow of ash logs to the extent that lumber supply has not kept up with demand. The prices of what we call the ratchet species—beech, sycamore, and cottonwood — were flat, as usual, but unexpectedly, black cherry lumber prices were also flat. Basswood, hickory, hard maple, soft maple, white oak, red oak, yellow poplar, and black walnut increased since the first of the year. The largest increase was for black walnut, which is back to 2004 levels. Red oak lumber has gone back up to 2006 levels. Increased lumber prices are due in part to reduced log supply. The reduction in stumpage availability was noted above, but another critical factor is a significant reduction in the availability of loggers. At the low end of the logging business, it’s easy for operators to come and go from the business with used equipment and to acquire timber "on the shares." This doesn’t require working capital to buy stumpage ahead of logging. The most efficient loggers with access to capital have survived the downturn, as have those specializing in the "tender-loving-logging" required for very high value trees destined for the veneer market. Many of the operators in the middle don’t have access to capital and have stayed out. It will take an overall increase in economic activity to free up loans for loggers in what is a very risky business. Until then, log supplies will remain tight, driving up lumber prices for those species for which demand increases. Sawlog Prices The number of mills reporting sawlog prices was down about 50 percent compared to 2009 (Table 1). Softwood Logs The average for the seven mills reporting pine sawlog prices (end of Table 1) was up from $210 in 2009 to $223 this year. One veneer mill reported a price for pine logs to be sliced, but it’s not clear if this was for logs produced in-state. Red cedar dropped to $375 from $404 with only three mills reporting cedar prices this year. Veneer Log Prices Veneer log prices (Table 2) Black walnut veneer log prices were up across the board, except for the largest size class. Modern veneering techniques, especially trimming for export sales, have reduced the premium for larger logs. Steaming to soften the wood for slicing provides a more-or-less uniform color across sap and heart wood for the lumber market, but the sap wood is clipped off for walnut veneer. Like white oak, however, the percentage of heartwood does increase with log diameter. There was somewhat of an uptick in white oak demand last winter, but it wasn’t sustained. Prices were up for the smaller log sizes only. We don’t think our prices reflect the pick-up in the tight cooperage market reflecting an uptick in the market for bourbon and wine barrels. We’re also not clear on how our prices reflect the radial-sawn white oak market. This market requires high-quality logs, because the logs are sliced along the rays of the wood, rather than by the usual flat slicing technique. Hard maple veneer log prices were also up while yellow poplar was down based on the 3 mills that report poplar prices. Implications It’s a wonder that hardwood markets, especially for logs, have increased to the extent reported. Some upward price pressure on logs will continue until the capacity of the logging industry catches up with the volume that timber buyers would like to move to their mill yards. Given the current 12-month inventory of unsold homes that must work down to no more than a 6-month inventory before hardwood sales improve, the hardwood industry cannot look forward to a significant increase in demand for at least 12 months. Many economists are predicting at least 18 months of continued very slow growth. Concerns about the national debt and tax policy, among others, have severely reduced the willingness of businesses of any size to take a chance on stepping-up production in anticipation of an economic recovery. We assume that stumpage prices have increased along with log prices, but forest owners should consider that these higher prices are based on a much lower volume of stumpage purchases than at any time since the mid-1970s when hardwood lumber production started an upward trend, ending in 1999 (Hardwood Market Report, 2010, No. 33, p. 1). Eastern production is almost 50 percent lower than this peak. It appears that the largest proportion of Indiana forestland is owned for reasons other than financial returns from timber production. This fact tends to reduce the number of owners wanting or needing to sell stumpage. As a result, it’s highly unlikely that stumpage prices will back off significantly because more sellers are calling timber buyers. Biomass production continues to be a hot topic. The long-established demand for mill residue will continue and increase somewhat for mulch and wood pellets. Also, harvesting primarily for conversion to pulp chips will increase because of the large decrease in chips available from sawmills. But, we believe that we’re about at the peak of irrational expectations regarding wood-fired, stand-alone electricity plants. Much of the planning for green-energy facilities and technological development is driven by federal tax and cost incentives. There will be forestland owners willing to have their land clearcut for energy and pulp chip markets, but the desire of most private owners to carry stocking based primarily on aesthetics will make for tight stumpage markets for these end uses. It’s hard to compete with coal in this region, unless air pollution rules are changed. Cap-and-trade is dead in this Congress, but EPA will be announcing their command-and-control rules by the end of year. It will be after these rules make their way through the courts before there’s a major impact, changing the way some firms operate. The consulting group FORISK provides excellent monthly updates on the bioenergy industry in the United States (http://www.forisk.com/News-v-38.html, accessed 8/26/10). Their August white paper notes three realities of the industry: (1) half of announced bioenegy facilities will fail, (2) forest owners are long-term managers, not day traders, and (3) wood suppliers and loggers adapt to new markets incrementally. Thus, knee-jerk policy action is not wise. Custom Costs The average cost reported for custom sawing was down to $275 per MBF, compared to $297 per MBF last year, Table 3. The mills reporting are primarily small "local" mills, many portable. Three mills reported on a per-hour basis, but the large spread in prices makes the change from last year hard to determine. We can say that the overall response from custom mills was down. Many owners said they are not operating until things get better. We also get many reports of mill owners not working because of their age, and in some cases because the owner is no longer with us. Reported logging cost rose from $139 last year to $159 this year. The response for hauling cost was also small, as usual. It appears that the $25 to $35 per MBF remains in the ballpark. Miscellaneous Products The average price paid for cant logs (i.e., logs sawn for pallet lumber, railroad ties, and industrial and trucking blocking) was $238 per MBF compared to $226 last year, Table 4. The price per ton decreased to $28 from $31 in 2009. Pulpwood and chip prices increased substantially for the reason discussed above. Indiana Timber Price Index The delivered log prices collected in the Indiana Forest Products Price Survey are used to calculate the delivered log value of typical stands of timber. This provides trend-line information that can be used to monitor long-term prices for timber. The species and quality distribution used to calculate the weighted averages can be found in the complete report at http://www.ag.purdue.edu/fnr/Pages/extforestsprice.aspx. These weights are based primarily on the 1967 Forest Survey of Indiana. When we first developed this index some 25 years ago we promised to update the weights used for species and quality when information became available. This was done this year using all available U.S. Forest Service survey data. Trending was used to smooth the changes to the weights between survey years. The revised weights did not make a significant difference in the index. We can make this information available to anyone interested. But, for now we’ll continue to use the historical weights. Average Stand The nominal weighted average price for a stand of average quality increased from $358.8 per MBF in 2009 to $412.5 in 2010. This is a 15.0 percent increase, the largest increase since the 1977/1978 jump of 26.6 percent, year-to-year. Remember that this series is based on delivered log prices, not stumpage prices. The deflated or real price increased from $208.50 to $230.30, a 15.0 percent increase. This increase was not enough, however, to reverse the slow decline in the trend-line rate for the real price series. It went from 0.95 percent simple annual compound rate of interest last year to 0.91 percent this year. The new equation for the trend line for the 1957 to 2010 period is, Avg. Stand Real Price = 175.95 + 2.08 ´ T, where, T=1 for 1957, 2 for 1958 . . . 54 for 2010 A linear trend line should be used to project real prices of a commodity like hardwood logs. Although it's easier to simply plug an annual compound rate of increase into the compound interest formula (exponential rate of increase), projections for much longer than 10 years give grossly unrealistic results. Real prices can't increase exponentially for long periods of time. The market adjusts by using more substitutes for "real wood" and through the willingness of consumers to accept substitutes. When a market economy works adequately, the relative prices of substitutes stays in balance, assuming extraction and conversion costs stay relatively the same per unit of output. Given increased lumber overrun, thinner veneer, and changes in the export incentives provided by the governments of developing countries, generalities are dangerous. The equalization of environmental standards, reflected in the rules actually enforced, has yet to be achieved. Quality Stand The nominal weighted average price for a high quality stand increased from $512.0 per MBF in 2009 to $584.1 this year, a 14.1 percent increase. The average real price series for a high quality stand increased from $297.5 in 2009 to $326.1 per MBF this year, a 10 percent jump. The average annual compound rate of increase for the trend line declined from 1.25 percent per annum in 2009 to 1.21 percent this year. The equation for the trend line is, Quality Stand Real Price = 210.77 + 3.62 ´ T, whereT=1 for 1957, 2 for 1958 . . . 54 for 2010 Comparing the trend lines for the real price series for the average and quality stand indicates that some improvement in the quality of a stand results in an increase in the real rate of return. Dr. William Hoover is a professor of forestry in the Department of Forestry and Natural Resources at Purdue University. Greg Preston is the state statistician for the Indiana Agricultural Statistics Service in West Lafayette, Indiana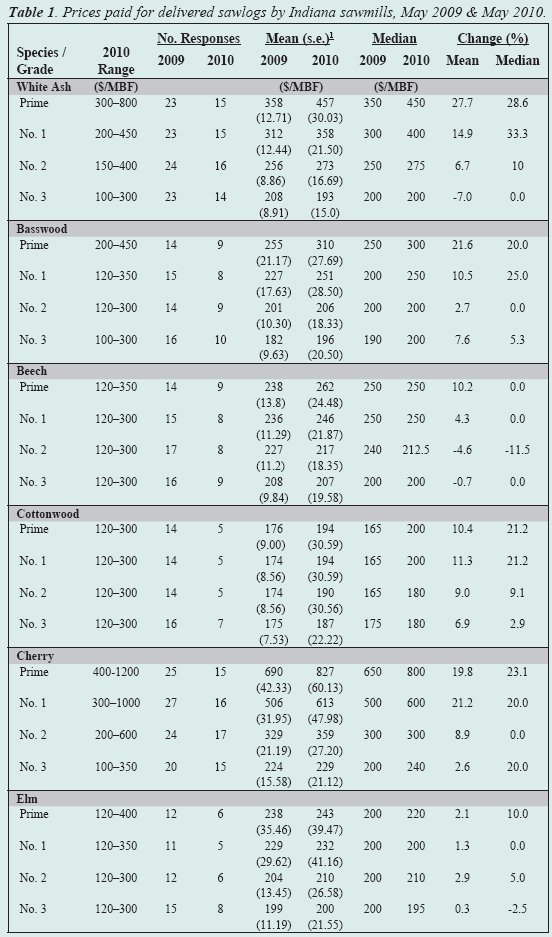
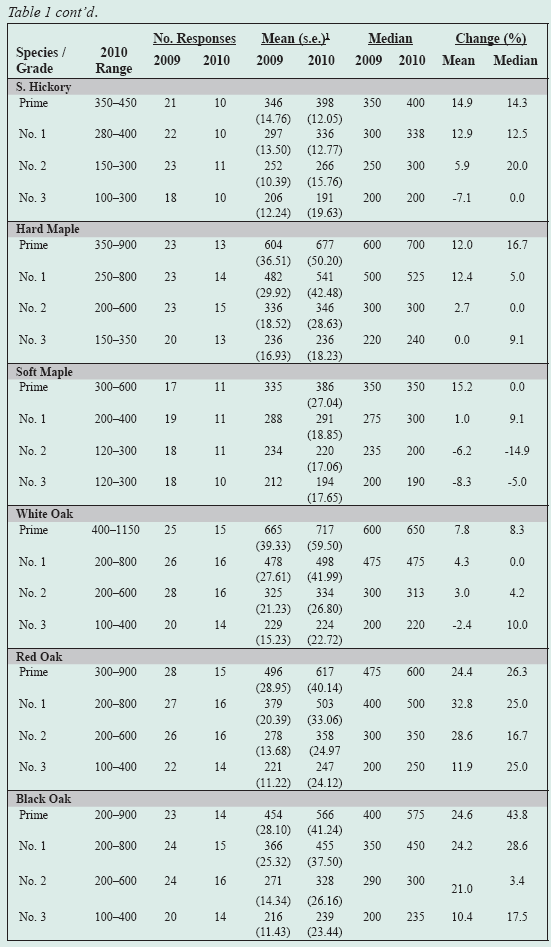
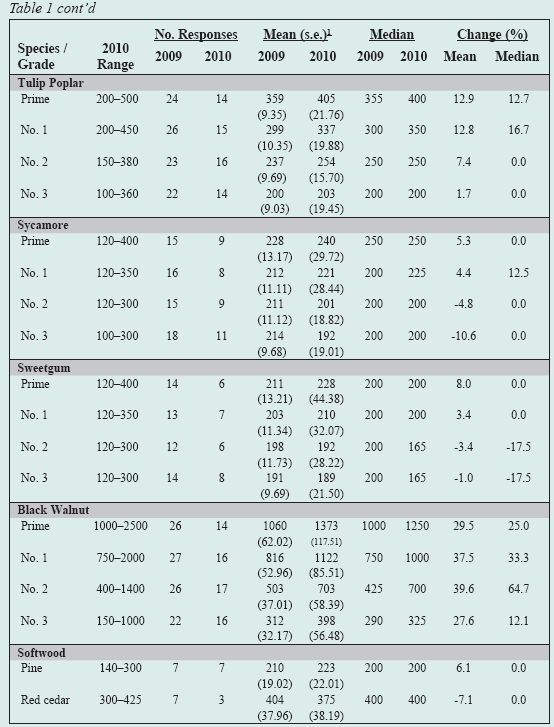 Based on the discussion of lumber price trends, we’d expect delivered log prices to be up proportionately more than lumber prices. They were for all species except for the lower grades of soft maple, sweetgum, and sycamore. Red oak and black walnut increased the most, falling in the 20 to 30 percent range. Surprisingly, black cherry increased, even though there was little apparent pull from lumber prices. The real price of black walnut sawlogs continues to increase faster the black walnut lumber prices. This squeezes sawmills to increase efficiency and otherwise cut costs.
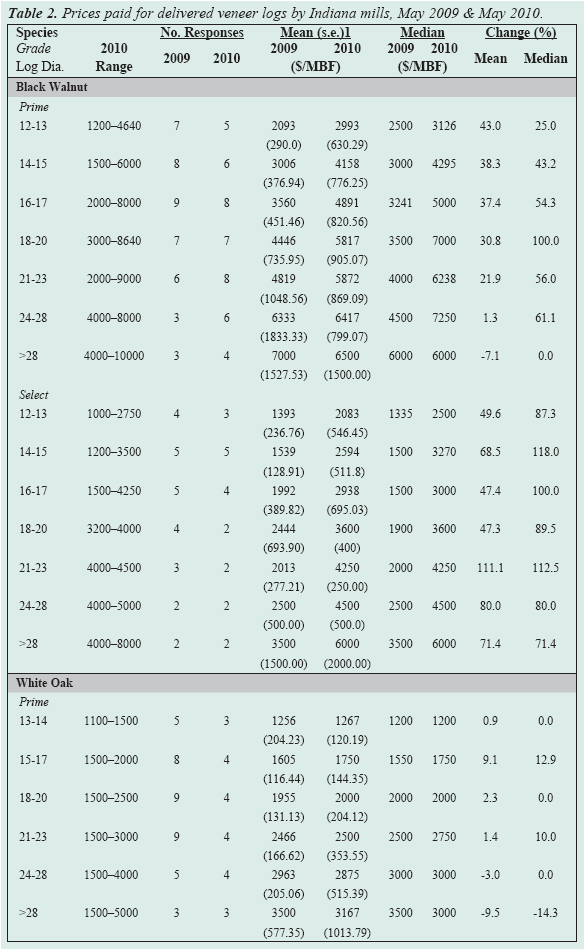
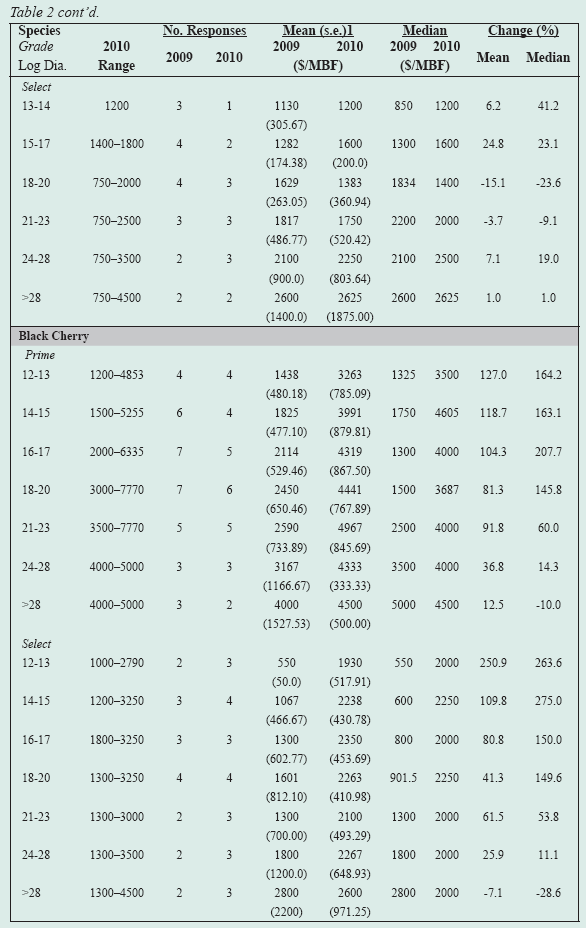
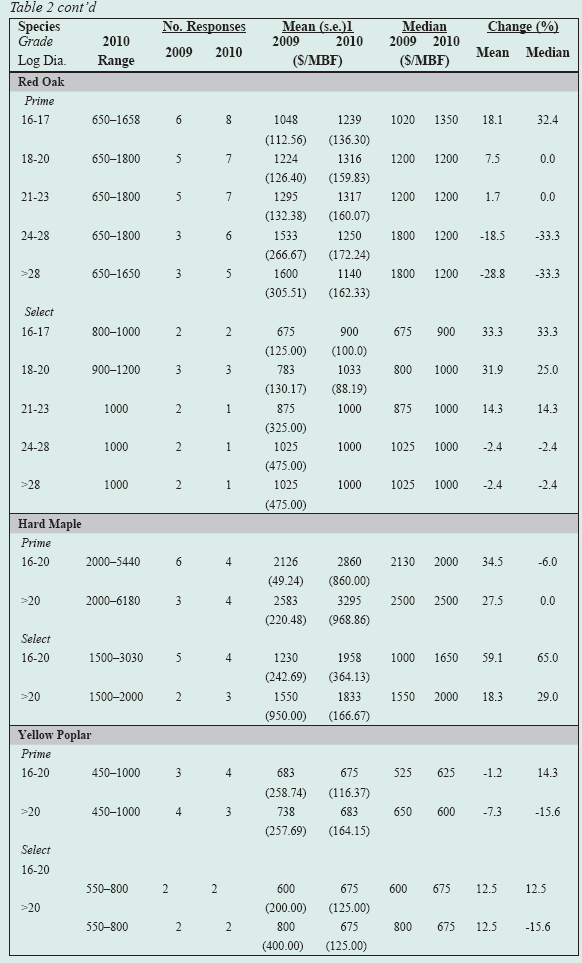 also were up for most species and grades. White oak prices were down except for the smaller logs. Black cherry veneer log prices were up significantly more than sawlog prices. Prices were down substantially from 2008 to 2009. It’s not unusual for the prices for sawlogs and veneer logs of a given species to move independently, since the end-use markets differ.